MAINTENANCE METRICS
MTBF, MTTR and availability: how to calculate and read them
Three numbers are enough to describe the health of an asset fleet: MTBF says how often an asset fails, MTTR says how long it takes to come back, and availability combines both. The hard part is calculating them on the right basis, and knowing what they hide.
What these three metrics actually measure
The terminology is fixed by EN 13306, the European standard that defines maintenance vocabulary. MTBF (Mean Time Between Failures) is the average operating time between two stoppages. MTTR (Mean Time To Repair) is the average time needed to put the asset back into service.
A common trap: MTBF is not a service life. An asset with a 2,000-hour MTBF does not fail every 2,000 hours. It is a statistical average, and it only means something over a sufficient number of events.
The formulas, and above all the counting conventions
MTBF = total operating time ÷ number of failures.
MTTR = total repair downtime ÷ number of repairs.
Availability = MTBF ÷ (MTBF + MTTR).
These formulas look simple, but everything depends on what you decide to count. Three questions to settle before you calculate, and to write down:
- What counts as a failure? Does a 10-minute adjustment stop count, or only unplanned stoppages?
- Does waiting count as repair time? If the technician waits three days for a part, is that MTTR?
- What is the observation window? A month, a quarter, a year?
Without a written convention, two people calculate two different MTTRs on the same fleet and the discussion stops there. It is the first reason a maintenance dashboard fails.
A worked example
These are the values a LODÉGE dashboard actually displays, over a 7-day window and a fleet of 38 assets:
| Metric | Displayed value | What it means |
|---|---|---|
| Assets | 38, of which 37 in service | The scope analysed |
| Work orders | 2, of which 1 completed | The volume of events in the period |
| Availability | 100.0% | No unplanned stoppage in the period |
| MTTR | 54 min | Average time to return to service |
| MTBF | 0 d 4 h 48 m | Roughly 4.8 h of running time between two stoppages |
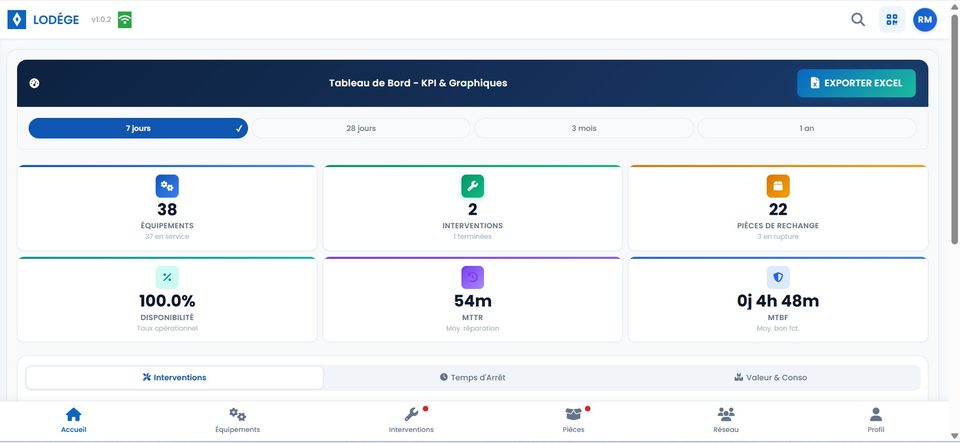
This table holds a lesson the formulas do not teach. Availability of 100% with two work orders can mean two opposite things: either the asset never suffered an unplanned stoppage, or the period is too short and the stoppages were never recorded.
That is why an MTBF of 4 h 48 min over 7 days can never be compared with an MTBF calculated over a year. A metric without its observation window means nothing. The LODÉGE dashboard offers 7 days, 28 days, 3 months and 1 year for exactly this reason: same formula, different story.
What the numbers hide
Availability of 99.75% looks excellent. It can still hide two problems that the average flattens out.
The first: an average says nothing about distribution. Six 54-minute stoppages are very different from a single 5 h 24 stoppage — same total, same MTTR, but nothing like the same disruption to production.
The second: one failure can hide another. If the same asset goes down six times in the quarter, the question is not “how long to repair” but “why it keeps going down”. MTTR measures the quality of the intervention; it does not measure the quality of the diagnosis.
This is where preventive maintenance changes the picture: acting before failure moves the problem from MTTR to MTBF. You do not intervene faster, you intervene less often.
Collecting the data without losing your day
These metrics are only worth something if collection is reliable and regular. ISO 14224 provides a framework for collecting and exchanging reliability and maintenance data. It does not impose a tool, but it does impose rigour: the same failure categories, the same time boundaries, the same definitions from one site to another.
In practice that means every work order is recorded with a start time, an end time, a cause and the asset concerned. On paper the data exists but nobody aggregates it. In a spreadsheet aggregation is manual, so it is abandoned by the second month. That is the argument for a dedicated tool — we come back to it below.
Three mistakes that make a dashboard useless
- Mixing stoppage types. A stoppage planned for preventive maintenance must not enter the MTBF: it is not a failure.
- Averaging incomparable assets. A fleet-wide MTBF mixing a press and a forklift means nothing. Analyse by asset family, or by criticality.
- Tracking numbers without a threshold. A metric without a target is not a metric, it is decoration. Set a target per critical asset and watch the gap.
Tracking these metrics day to day
LODÉGE calculates availability, MTTR and MTBF from the work orders recorded, over periods from 7 days to 1 year. Because the definition of stoppages and durations is fixed once in the tool, everyone reads the same number.
That is the starting point: a shared metric, calculated consistently, and discussed with the teams.
Sources
- EN 13306 — Maintenance terminology — Defines the normative vocabulary: corrective maintenance, preventive maintenance, failure, uptime.
- ISO 14224 — Collection and exchange of reliability and maintenance data — Reference framework for collecting and comparing reliability data across sites.
Read next
See these principles in practice
LODÉGE brings work orders, equipment, parts and metrics into one application, available from the office and in the field.